
Dashboard
About the project
The project is an extension of the Melbourne property story.
Goal
The project aims to create an interactive dashboard for the audience of Melbourne property story. The dashboard offers the opportunity for self-investigating the suburbs.
Data
The project used public data from Domain Media (texts), State Government of Victoria (property price report)
Methodology
The dashboard was created using R shinyapps and supportive libraries.
Outcomes
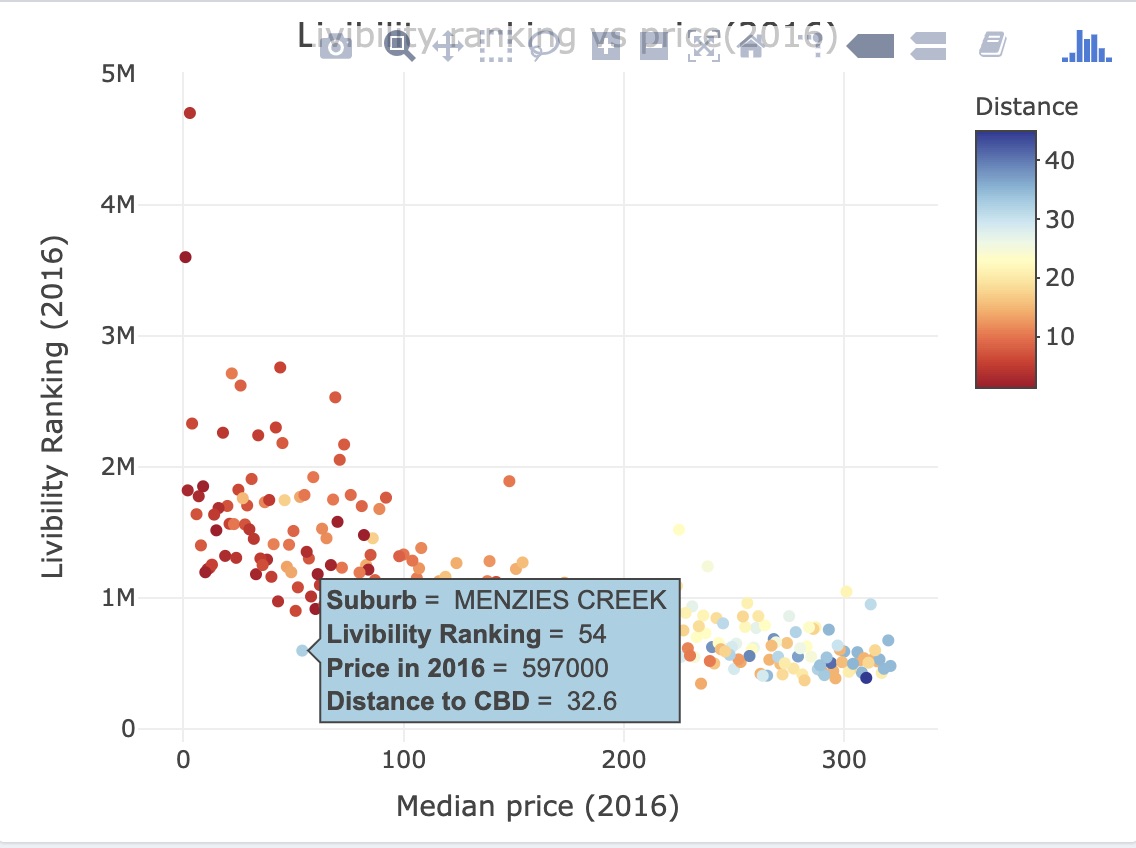
The dashboard allow users to find which suburb that would like to buy based on the livability ranking, median price and distance the the Central Business District.
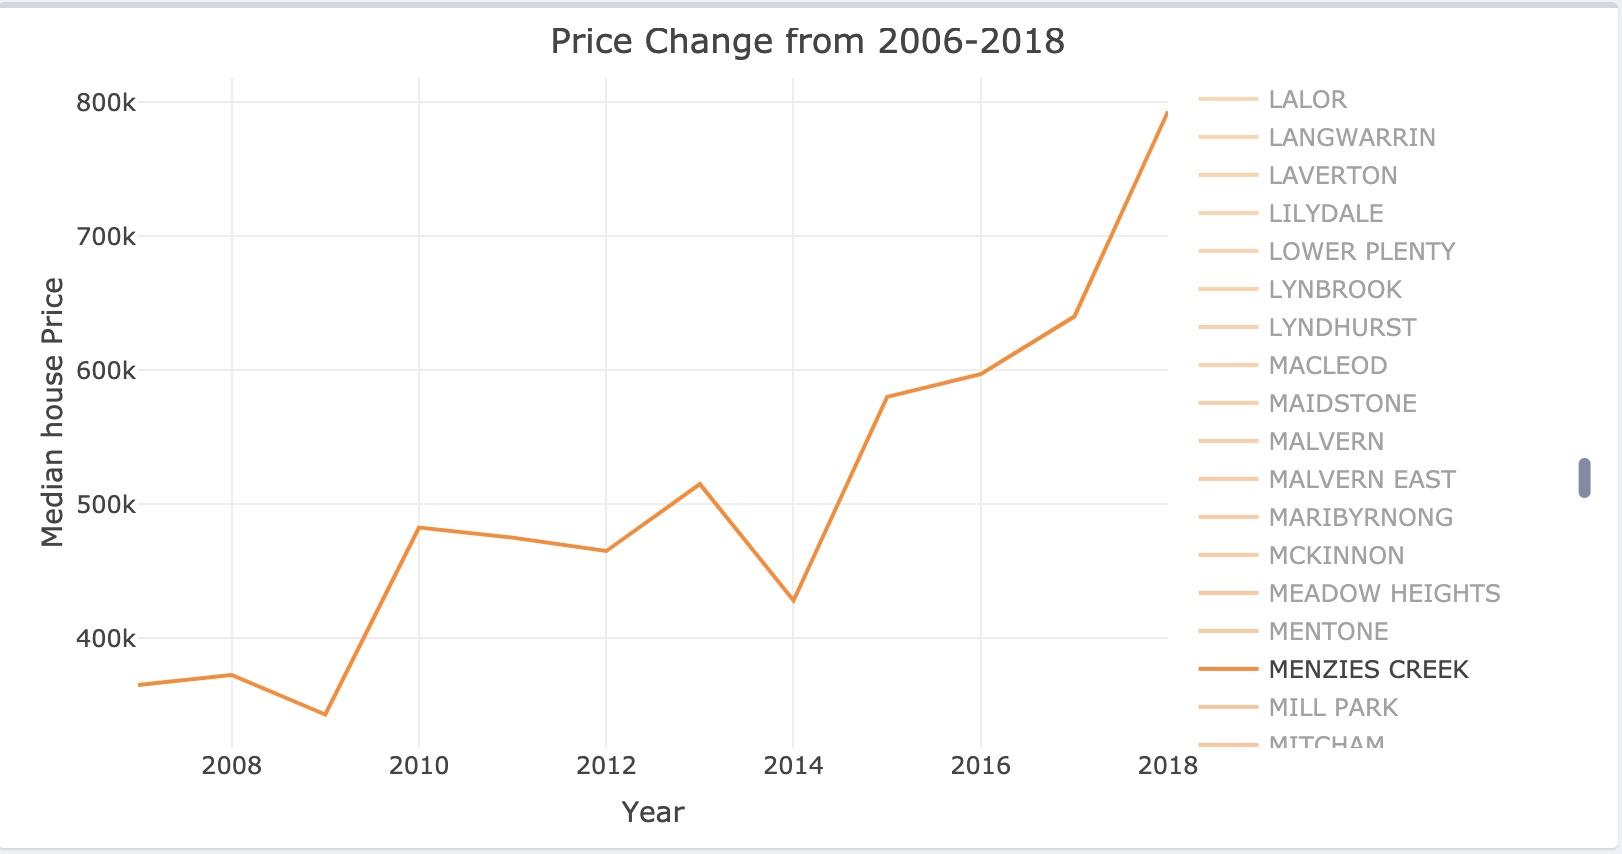
In this example, I chose MENZIES CREEK.
Then we can investigate the growth of MENZIES CREEK.
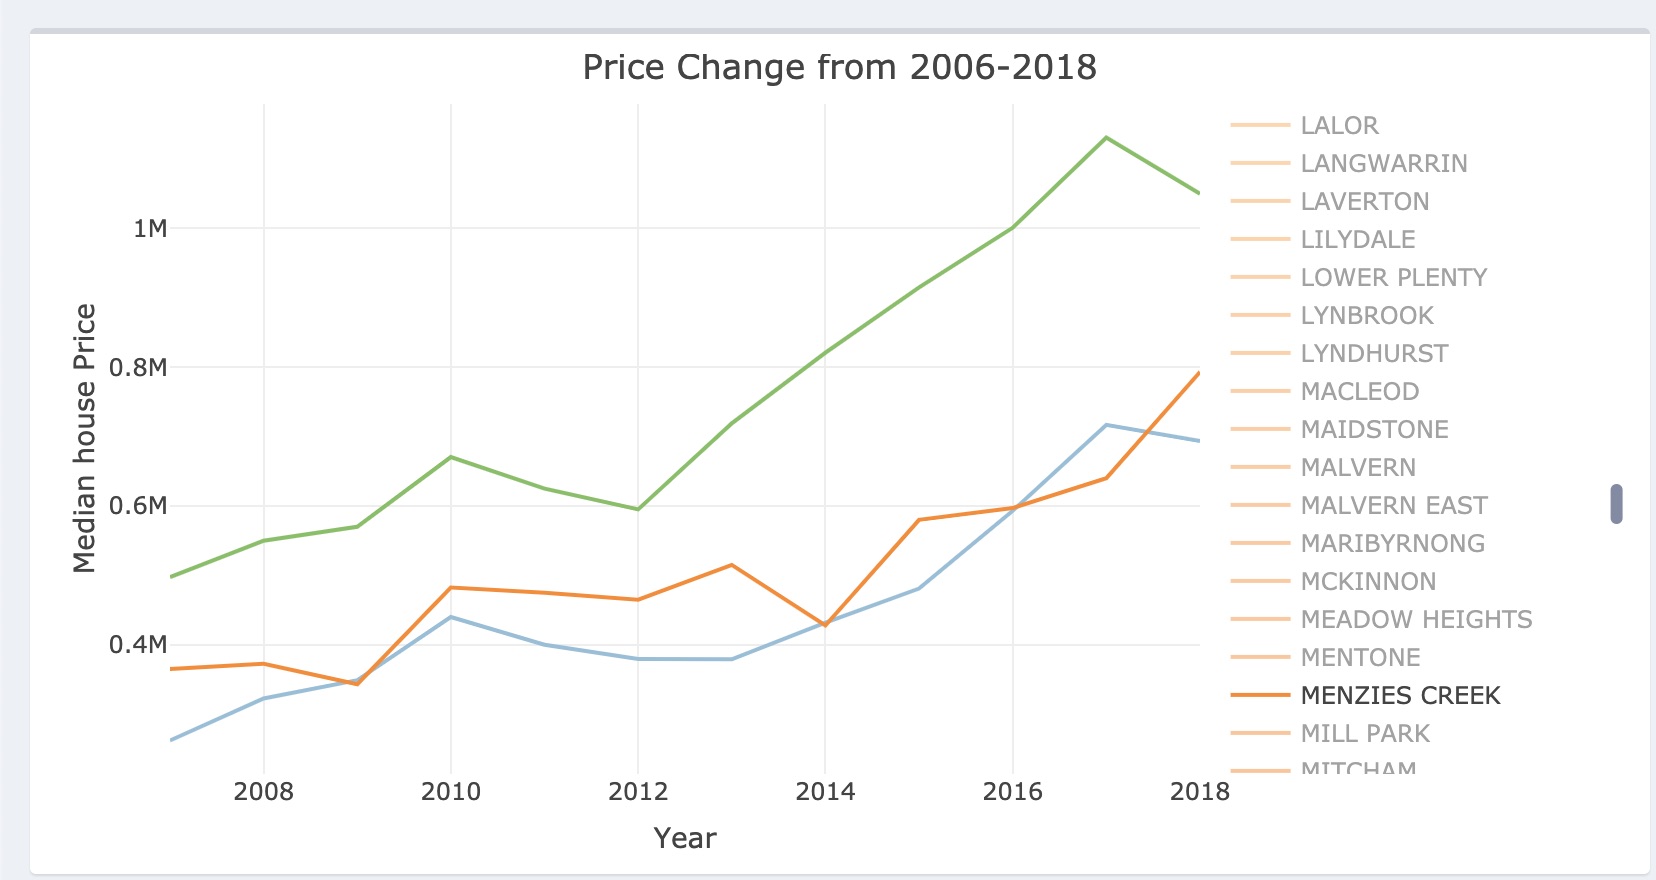
In addition, the dashboard also provides the opportunity to compare this growth with all of the other suburbs,
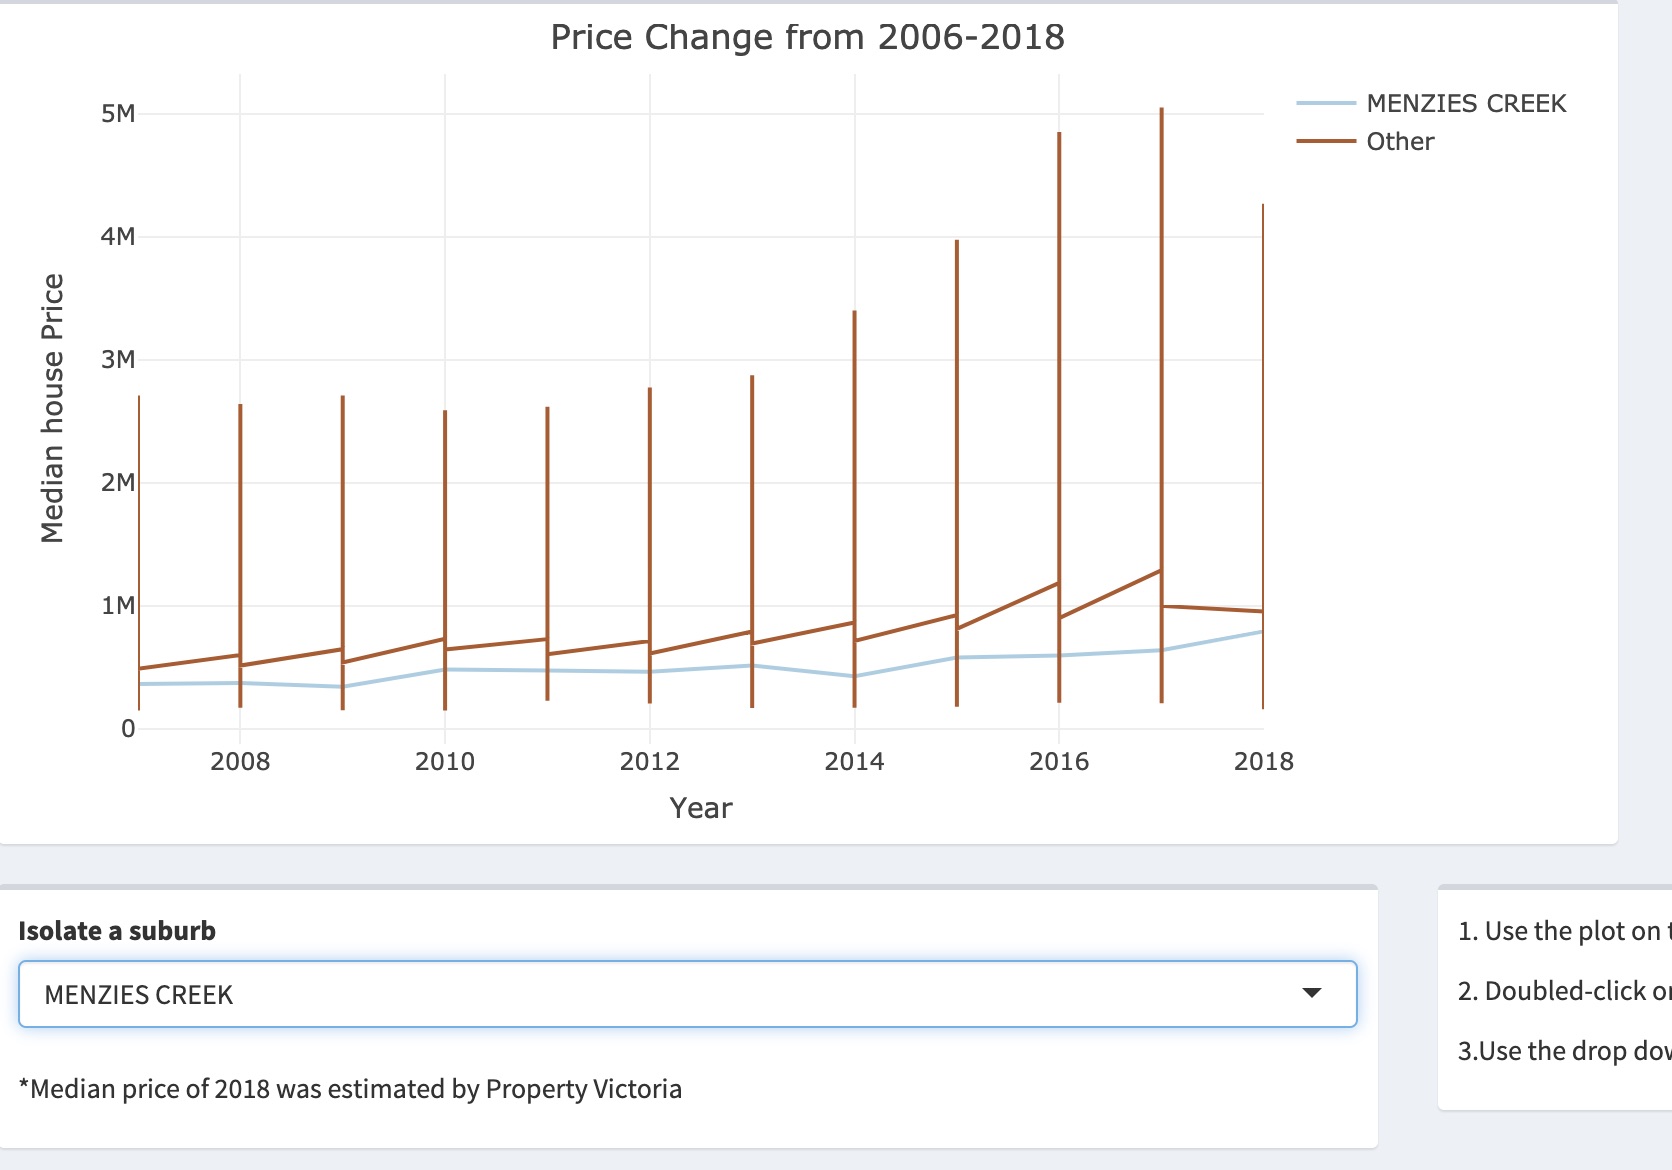
or some specific ones.
You can interact with the dashboard here.
Limitations
The dashboard suffers from a few limitations, the main ones include:
- The lack of communication between the two main visualisations, users have to go choose the suburb manually.
- The dashboard is yet intuitive, instructions are required.
What I’ve learned from this project
-
People love to play: Interactive visualisation appeals to our curious nature and desire to play (Murray 2013, page 26-27).
-
Minimal viable analysis:
A. Create a usable analysis Melbourne property story visualisation.
B. Then present the insights with the audience, collect feedbacks.
C. Improve the analysis with more features based on the feedbacks the dashboard.
D. Collect more feedbacks and the cycle continues.
Note: The quicker we can produce a viable analysis, the earlier we can receive feedbacks and improve the analysis; the analysis process is cyclical rather than linear.
The project demonstrates the ability to work with R libraries including plotly, shiny, and other supportive libraries.