
Predicting Revenue-Related Metrics using Google ads data, phase 2
About the project
This is the second phase of the Predicting Revenue-Related Metrics using Google ads data, to check phase one please follow this link.
Goal
The project was designed to test different regressors in order to predict the revenue-related metric*, using Rooted Mean Squared Error(RMSE).
Data
This dataset contains online advertising data where the target feature is a revenue-related metric and the descriptive features are various advertising metrics and characteristics. The details of how this metric was created or what it measures was not given by the clients. The data includes information of Display Advertising, you can learn more about it here.
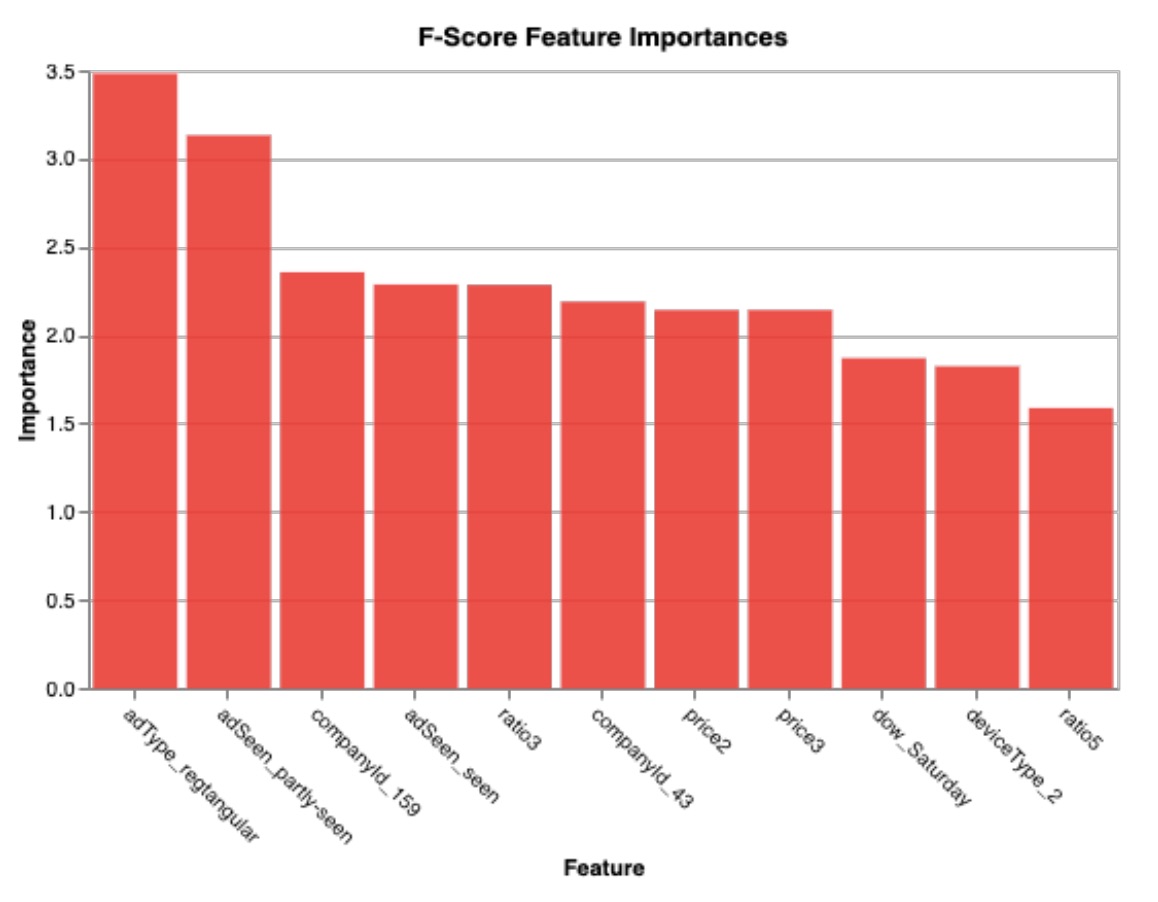
Outcomes
Overall, most of models have the RMSE is around 1(0.9) dollar. The feature-selection using F1 score suggested that some important variables are the types of ads (asType), how much of the ads was seen (asSeen), which day of the week the ad was seen.
Limitations
The project does have its a few flaws and limitations (details in the report)
What I’ve learned from this project
- Overfitting: The models with the lowest training RMSE does not guarantee the good RMSE in the test dataset.
- Data preparations It is necessary to re-visit the data preparation process through out the project.
- Expert knowledge The feature-selection process was based purely on technical indications; which only optimised for RMSE. Expert knowledge regarding the features in the business context can add further value to the project.
You can download the Jupiter Notebook report here.
Note: The details of the revenue-related metric was withheld due to privacy reasons.
The project demonstrates the ability to work with Python libraries including Matplotlib, NumPy, Pandas, Seaborn and Sklearn(KNN, Decision Tree and other regressors)